Determination of soil phosphorus level is an important factor affecting crop production and P-use efficiency in the study area. Fertilizer requirement mapping is the way of determining fertilizer demanded by specific crop production type on the basis of soil sample testing results. In order to make efficient fertilizer application for wheat at Wachale district, the study was conducted to map phosphorus requirement for wheat crop. Starting from soil sample collection, laboratory analysis and interpretation and mapping standard methods and tools were used. The total soil samples collected for the wheat potential kebeles were 167 and phosphorus requirement mapping was done for analyzed soil samples. Based on the laboratory result, phosphorus requirement was calculated by subtracting initial soil phosphorus from phosphorus critical for wheat at the study area. Considering the minimum and maximum level of phosphorus requirement, the output of the result ranges from 18.04 to 45.98ppm for the areas under consideration with an average of 31.43ppm. Large areas (84393.29ha) of the district require 20 to 35ppm and the smallest area (348.64ha) require 15 to 20ppm of phosphorus fertilizer for wheat crop production. Consequently, phosphorus fertilizer application rate for wheat crop might be very efficient by using the map, otherwise using the mean rate (31.43ppm) appropriate than blanket application rate. The map of phosphorus requirement in ppm was predicted for unknown locations by using ordinary Kriging interpolation of ArcGIS10.3 software.
This is an Open Access article, distributed under the terms of the Creative Commons Attribution 4.0 International License (http://creativecommons.org/licenses/by/4.0/), which permits unrestricted use, distribution and reproduction in any medium or format, provided the original work is properly cited.
Soil fertility is a key factor for successful crop production and it is a measure of capacity of soil to supply plant nutrients. Soil fertility and fertilizers are very much closely related term where; soil fertility acts as a ‘Sink’ of nutrients for maximum yield, where as fertilizer, acts as a ‘Source’
[1]
Xia, H. Y.; Wang, Z. G.; Zhao, J. H.; Sun, J. H.; Bao, X. G. and Christie P. et al., (2013). Contribution of interspecific interactions and phosphorus application to sustainable and productive intercropping systems. Field Crops Research, 53-64.
[2]
AGRI-FACTS, (2013). Phosphorus Fertilizer Application in Crop Production.
[1, 2]
for continuous pull of different nutrients and also add to the sink. The importance of soil fertility and fertilizer management is being increasingly recognized recently in all parts of the countries to meet the demand for food and other agricultural raw materials. Intensive use of fertilizer, intensive cropping system with high yielding crop varieties has no doubt increased the food production and reduced the food shortage if used efficiently
[3]
Kefyalew Assefa (2017). Phosphorus Critical Level and Optimum Nitrogen Rate Determination on Teff for Sustainable Soil Fertility Management and Economical Teff Production at Lume Area of Oromia Region, Ethiopia.
[3]
. On the other hand, fast depletion of nutrients due to over exploitation, a wide spread deficiency of N, P, K and S coupled with micro nutrients deficiencies especially Zn and B has been noticed in many soils.
Soil nutrient depletion may occur due to; deforestation, soil erosion, soil degradation, nutrient losses, excessive fertilizer application and leaching losses. With all these conditions, soils become deficient and very “hungry” for the need of nutrients to plants day to day
[4]
Addis, H., Klik, A., Oweis, T. and Strohmeier, S. (2016). Linking selected soil properties to land use and hill slope: A watershed case study in the Ethiopian highlands. Soil and Water Research Journal, 11: 163-171.
[4]
. These problems cannot be solved by ordinary supply of plant nutrients, but their efficient management is also very important aspect since the fertilizer is one of the costliest inputs
[5]
Gebreyesus, B., (2013). Soil quality indicators response to land use and soil management systems in Northern Ethiopia’s catchment. Land Degradation Development.
[5]
. It requires a well-balanced scheduling of fertilizers to get maximum returns with minimum investment. Apart from fertilizers, due to lack of biomass resources, farmers are not in a position to apply sufficient organic manures and the future of Ethiopian agriculture should better relate to scientific management of soil fertility along with efficient use of chemical fertilizers. It is therefore, imperative that sound-full soil and crop management practices, thoughtful use of fertilizers and integrated nutrient management practices
[6]
Karltun, E., Lemenih, M. and Tolera, M. (2013). Comparing farmers’ perception of soil fertility change with soil properties and crop performance in Beseku, Ethiopia. Land Degradation Development, 24: 228-235.
[7]
Okubay, G., Heluf, G. and Tareke, B. (2015). Soil fertility characterization in vertisols of Southern Tigray, Ethiopia. Advances in Plants and Agriculture Research, 2: 1-7.
[6, 7]
must be adapted to improve and maintain good soil fertility for the purpose of sustained crop production.
In Ethiopia for more than a decade, there were site specific calibration studies to shift blanket rate of fertilizer recommendation. In progress the requirements of some crops are already known, even though most of the research sites were different and concerned to soil variability spatially. In response to this, Oromia Agricultural Research Institute (OARI) has started site specific calibration studies before a decade by its four soil research centers and other centers. At the end of calibration work it is known that every soil research center of OARI initiates for further verification activities of the study area.
However, the problem related this is “how do farmers use the recommended fertilizer rates or verified rates” and this demands the farmer to bring their soils by sampling appropriately to laboratories to have recommended rates of fertilizers for their farm lands. This kind of approach is not feasible for fragmented farming system which is characterized by diversified owners and culture. In addition, it’s difficult to farmers to bring their soil by sampling appropriately and bring to laboratories to have recommended rate of fertilizer for their farm land. To solve these problems application of geospatial tools is mandatory, in order to give comprehensive/general recommendation at district, kebeles, mapping units and farm levels. These can be done through manipulation of past recorded research outputs like fertility assessment and calibration studies in harmonized way.
Soil mapping tries to segregate a landscape/district into units having similar soil properties. As soil properties determine fertilizer requirement, the fertilizer recommendation area can be delineated. Fertilizer requirement map is the digital map that shows the amount of fertilizer required by specific crop in given area, Fertilizer requirement= (Pc-Po) Pf, where Pc=phosphorous critical, Po = phosphorous in the soil, Pf= phosphorous requirement factor. Site specific soil fertility management is economically optimum application rates of fertilizers/inputs/ due to its importance to determine fertilizer requirement, fertilizer recommendation and identify soil physical and chemical properties and soil fertility maps and fertilizer requirement maps were made from composite soil samples collected and analyzed in the laboratory using geo statistical interpolations systems to predict for non-sampled locations based on each parameter.
Hence this activity was designed to integrate the environmental factors in comprehensive manner through application of (Geographical Information Systems) and Remote Sensing tools and the comparison of geo statistical equations were used in solving the problem of interpolation biasness. That is where site specific fertilizer recommendations are more comprehensive and beneficial since they can help to tailor fertilizer use more efficiently. Soil test crop response-based Phosphorus calibration studies were conducted at Wachale district by Fitche Agricultural Research Center and the center determined and verified Pc and Pf and following this activity fertilizer requirement map for wheat crop was done in order to give fertilizer recommendation for the study area. Therefore, the study is designed with the following objectives; to map phosphorus requirement for bread wheat at Wachale district and to provide phosphorus requirement map at Kebele level in order to guide farmers in the study area.
2. Materials and Methods
2.1. Description of the Study Area
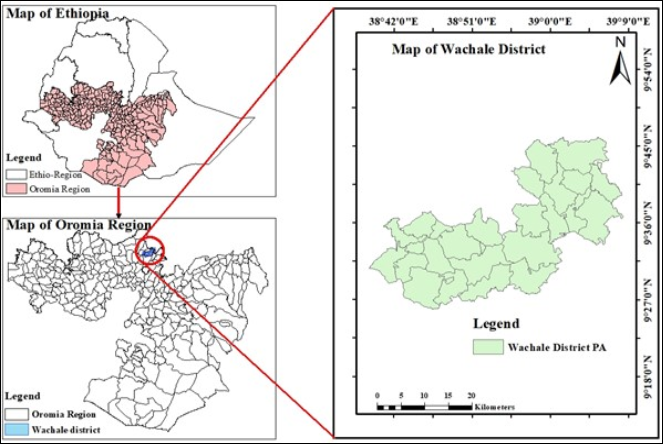
The study was conducted at Wachale district which was found in North Shewa Zone, Oromia regional State and 78 kilometers far from Addis Ababa (capital city of Ethiopia) to North and 34 Km from Fitche, the capital city of North Shewa Zone. The geographical location of Wachale district ranges from 9°25'2.13" to 9°48'44"N and 38°38'49.02 " to 39°08'41" E. The highest and lowest elevation of the district was 2880m and 1200m respectively. The climatic of the district experiences different temperature and rain fall patterns. Though not regular, the district experiences a mono modal rainfall during summer. As Wachale agricultural and natural resource management office of the district, the mean annual rainfall was ranged from 1000mm-1800mm and the lowest temperature was , the maximum was and the average temperature was in Wachale district.
2.2. Agriculture and Farming System
Agricultural production was characterized by a mixed crop-livestock production system (ZANRO, 2010). Like other parts of the Ethiopian highlands, the major farming systems of Wachale district was mixed farming; cereal crop cultivation and livestock rearing. Livestock production was the most important and popular agricultural activity next to crop production in the district, which supports the traditional subsistence farming of cereal crops. The crops such as; wheat, teff, oats and barley were the major crop in the study area.
Figure 1. Location Map of Wachale district in North Shewa Zone.
2.3. Soils Types and Topography
Soil is a biologically active, porous medium that has developed in upper most layer of earth’s crust. It serves as reservoir of water and nutrients, participates in the cycling of elements, and supports the growth of plants and soil organism
[8]
Brady, C. N., and Weil, R. R. (2014). The nature and properties of soils, USA, 401-442.
[8]
. In Wachale district, even though about five soil types observed in the district, it is mainly dominated by Pellic Vertisols, Vertic Cambicols, Rendzinas, Cambic Arenosols and Eutric Nitosols respectively.
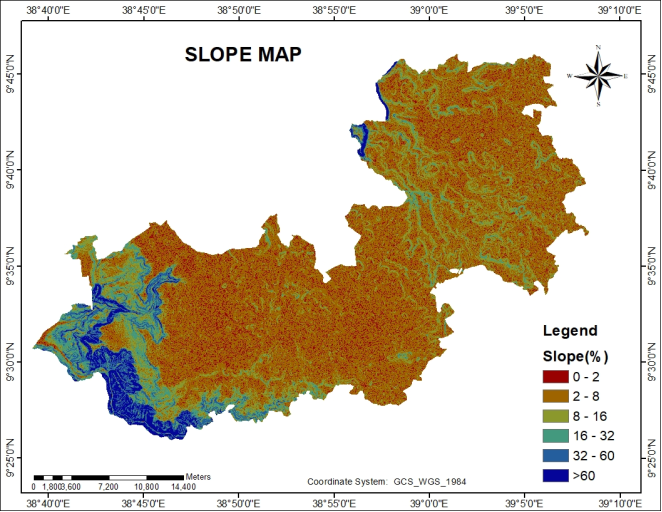
Topography is recognized as a critical factor influencing soil characteristics and agricultural productivity in the given area. The primarily variations in soil properties influenced by climate are controlled by slope percent and slope aspect
[9]
Chadwick K. and Asner G. (2016). Tropical soil nutrient distributions determined by biotic and hill slope processes. Biogeochemistry, 273-289.
[9]
. Topography not only contributes to the variation in soil properties, but also determines the types of crops that can be grown in different land uses. In the study area, majority of the areas under considerations were suitable for crop cultivation and the topography is characterized by flat, undulating, moderately sloping, moderately steep, steep and very steep as indicated in (Table 1).
Table 1. Description and slope percentage of the study area.
S/No
Slope (%)
Description
Suitability for agriculture
1
0-2
Level/flat
Suitable
2
2-8
Undulating
3
8-16
Moderately sloping
4
16-32
Moderately steep
Marginal
5
32-60
Steep
Not suitable
6
>60
Very steep
Source:
[10]
FAO, (Food and Agriculture Organization). (2006). Guidelines for soil description. 4th Edition, Rome.
Figure 2. Slope Map of Wachale district in North Shewa Zone.
2.4. Land Use/Cover
The total areas of the district have different land use /cover components such as; cultivated lands (70%), grazing land (21%), forests land (1.5%), lands under different purposes (6.5%) and swampy area (1%) respectively
[11]
Agriculture and Rural Development of Oromia (ARDO), (2005). Socio-economic profile of North Shewa zone.
[11]
.
2.5. Soil Sample Collection
Surface soil samples were collected according to
[12]
EthioSIS (Ethiopia Soil Information System) (2014). Soil fertility status and fertilizer recommendation atlas for Tigray regional state, Ethiopia.
[12]
through composite sampling techniques where sampling points were determined by setting pre-defined sampling points. However, as some pre-defined points were found in unsuitable places for sampling (e.g. road, waterway, and household) they were re-located in alternate locations within nearby cropping fields mostly inside a radius of 50 to 100 meters. Each location was recorded with a Garmin Map 70 S GPS using Adindan_UTM_ Zone_37 N projected coordinates with 3-to-5-meter accuracy. After reading the coordinate points and elevation of sampling points, slope gradient (%) of the study area was measured using clinometer by standing in the center of the plot. Then, 9 composite soil samples were collected at 15 meters distance in a ring/circle method based on the complexity of topography and heterogeneity of the soil type. In order to address effective root depth of most annual crops, composite soil samples were collected from the top soil (0-20cm) for chemical analysis.
2.6. Field Data Collected
Field data on; soil type, land use/cover, topography, elevation data, geographic location, slope gradient, cropping history, fertilizer used and drainage condition of soils of the study area were collected.
2.7. Crop Data
Based on the result of calibration study conducted and verified in the district, determined P-critical values for bread wheat at Wachale district, a phosphorus requirement for wheat crop was done.
2.8. Determination of Phosphorus Requirement
The statistical and spatial variability of the soil parameter was analyzed by using statistical tools and geospatial tools of Arc GIS software respectively. Based on the variability of available soil phosphorus and crop phosphorus -critical level, crop phosphorus requirement was calculated by the following equation.
2.9. Map Preparation
Phosphorus requirement mapping was made using spatial analysis tool of ArcGIS10.3 at scale needed. The map was prepared for fertilizer rate (kg/ha) for P required for the crop at map unit level and the difference of phosphorus critical level for bread wheat (Pc = 9.5ppm) as well as; soil initial phosphorus (Po) was used to map and calculate phosphorus requirement. Finally, by using Ordinary Kriging Interpolation, the unknown area was predicted from sampled points. Then, the rates of phosphorus requirement were classified into different categories of defined interval.
3. Results and Discussionds
3.1. Soil Samples
The total number of soil samples collected to determine available phosphorus for wheat potential kebeles in Wachale district was 167. Accordingly, the soil sample collected were submitted to the laboratory and prepared properly for analysis. Based on the laboratory results analyzed by Olsen method, the maximum and minimum values for available phosphorus and phosphorus requirement (ppm) was recorded in the wheat growing areas of Wachale district depending on the soil Pc and Pf determined during calibration study as shown in (Table 2).
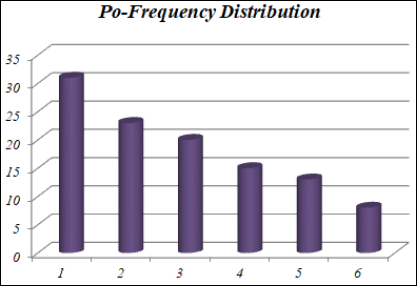
3.2. Available Phosphorus
The value of available phosphorus was obtained from soil fertility assessment and mapping conducted and used for phosphorus requirement mapping for the study area. Accordingly, the highest (8.23 ppm) and lowest (6.27 ppm) values were observed for area under consideration (Table 2). The variation of P-value obtained might be due to variation in soil parent materials, soil texture and soil pH in the study sites. According to ratings suggested by
[13]
Olsen, S. R., Cole C. V., Watanabe F. S. and Dean L. A., (1954). Estimation of available phosphorus in soils by extraction with sodium carbonate. USDA Circular, 1-19.
[13]
, the available P contents of soils were categorized under medium (5-10) soil P rating.
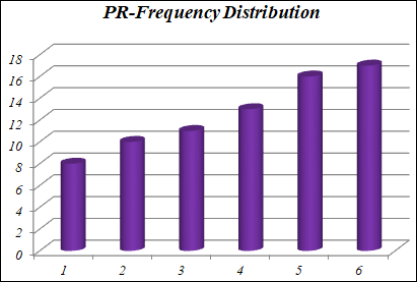
3.3. Phosphorus Requirement
Most crops require significant quantities of P during the early stages of growth and phosphorus requirements for optimum yields vary with different crop types. Based on the variability of available soil phosphorus and crop phosphorus critical level developed through calibration and the result of verification study for the study area. Crop phosphorus requirement was calculated using (po-pc)*pf set by
[14]
Taye B., Yesuf A., Sahlemedhin S., Amanuel G., Mohammed H., et al., (2000). Optimizing Fertilizer Use in Ethiopia: Correlation of Soil Analysis with Fertilizer Response in Hetosa Wereda, Arsi Zone. Sasakawa-Global 2000, Addis Ababa, Ethiopia.
[14]
for wheat. In the study area, the critical phosphorus level (Pc) for potential wheat crop growing kebele was 9.5. Consequently, the highest (45.98ppm) and lowest (18.04ppm) values of phosphorus requirement was recorded in the study area respectively as shown in (Table 2). Moreover, the frequency distribution of available soil phosphorus and phosphorus requirement (ppm) was also shown in (Figures 3 and 4) respectively.
Figure 4. Frequency distribution of PR in the study area.
Table 2. Statistical values of available phosphorus and phosphorus requirement (ppm).
Statistical parameter
Soil initial P (ppm)
Phosphorus Requirement (ppm)
Minimum
6.27
18.04
Maximum
8.23
45.98
Mean
7.41
31.43
3.4. Phosphorus Requirement Map
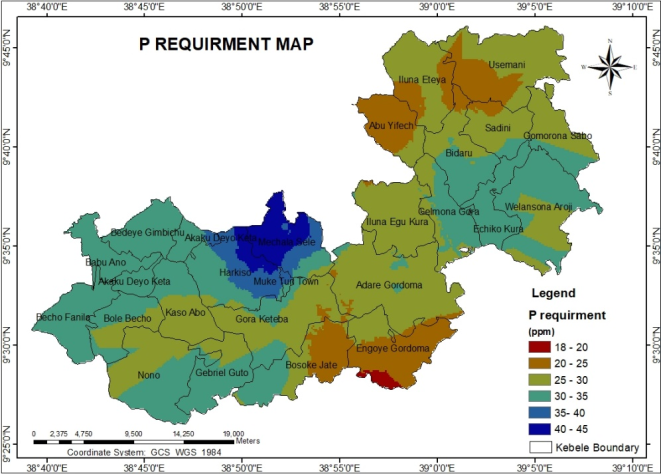
The map of phosphorus requirement for wheat crop at Wachale district was predicted for unknown values of locations by using ordinary kriging interpolation. The rates of phosphorus requirement were classified into different categories of specific interval which was determined to be 5ppm based on the number of recommendations. Based on the laboratory results and spatial analysis done to map p-requirement, about 84393.29 ha (93.35%), 5667.1 ha (6.27%) and 348.64 ha (0.39%) of the wheat potential kebeles require 20 to 35ppm, 35 to 45ppm and 15 to 20ppm phosphorus fertilizer respectively (Table 3). Accordingly, phosphorus fertilizer users can identify more relative rate for wheat crop production in the study area. The map of phosphorus requirement for wheat potential kebeles of Wachale district was shown in (Figure 5) and also predicted for the whole unknown locations.
Figure 5. Phosphorus requirement map of the study area.
Table 3. Phosphorus requirement (ppm) for Wachale district.
S/No
P-requirement (ppm)
Area (ha)
Percent (%)
1
18-20
348.64
0.39
2
20-25
11388.98
12.60
3
25-30
39167.75
43.32
4
30-35
33836.56
37.43
5
35-40
2839.3
3.14
6
40-45
2827.8
3.13
100
4. Conclusions and Recommendations
4.1. Conclusions
The study was conducted in wheat potential kebeles of Wachale district with the objective of phosphorus requirement mapping for wheat crop. The total soil samples collected for the wheat potential areas were 167, Pc was 9.5ppm and Pf was 14.23. Based on these values, phosphorus requirement was calculated by subtracting Po from Pc and the output of the result ranges from 18.04 to 45.98ppm for the wheat potential kebeles in the study area. Large areas (84393.29ha) of the district require 20 to 35ppm and the smallest area (348.64ha) require 15 to 20ppm of phosphorus fertilizer for wheat crop production. The map of phosphorus requirement was predicted for the whole unknown locations.
4.2. Recommendations
Phosphorus fertilizer rate for wheat crop is very efficient by using either the map or the mean rate (31.43ppm) which is more appropriate than blanket phosphorus fertilizer application rate. On the other hand, it was recommended that, any phosphorus fertilizer user might consider the minimum, maximum or average value obtained according to their specific farm land based on recommended rate due to the dynamic properties of soils or using the output at the end of validation in regular basis.
Abbreviations
ZANRO
Zonal Agricultural and Natural Resource Office
FAO
Food and Agriculture Organization
ARDO
Agriculture and Rural Development of Oromia
EthioSIS
Ethiopia Soil Information System
GPS
Geographical Positioning System
UTM
Universal Transverse Mercator
GIS
Geographical Information Systems
ppm
Parts Per Million
pH
Power of Hydrogen
Conflicts of Interest
The authors declare no conflicts of interest.
References
[1]
Xia, H. Y.; Wang, Z. G.; Zhao, J. H.; Sun, J. H.; Bao, X. G. and Christie P. et al., (2013). Contribution of interspecific interactions and phosphorus application to sustainable and productive intercropping systems. Field Crops Research, 53-64.
[2]
AGRI-FACTS, (2013). Phosphorus Fertilizer Application in Crop Production.
[3]
Kefyalew Assefa (2017). Phosphorus Critical Level and Optimum Nitrogen Rate Determination on Teff for Sustainable Soil Fertility Management and Economical Teff Production at Lume Area of Oromia Region, Ethiopia.
[4]
Addis, H., Klik, A., Oweis, T. and Strohmeier, S. (2016). Linking selected soil properties to land use and hill slope: A watershed case study in the Ethiopian highlands. Soil and Water Research Journal, 11: 163-171.
[5]
Gebreyesus, B., (2013). Soil quality indicators response to land use and soil management systems in Northern Ethiopia’s catchment. Land Degradation Development.
[6]
Karltun, E., Lemenih, M. and Tolera, M. (2013). Comparing farmers’ perception of soil fertility change with soil properties and crop performance in Beseku, Ethiopia. Land Degradation Development, 24: 228-235.
[7]
Okubay, G., Heluf, G. and Tareke, B. (2015). Soil fertility characterization in vertisols of Southern Tigray, Ethiopia. Advances in Plants and Agriculture Research, 2: 1-7.
[8]
Brady, C. N., and Weil, R. R. (2014). The nature and properties of soils, USA, 401-442.
[9]
Chadwick K. and Asner G. (2016). Tropical soil nutrient distributions determined by biotic and hill slope processes. Biogeochemistry, 273-289.
[10]
FAO, (Food and Agriculture Organization). (2006). Guidelines for soil description. 4th Edition, Rome.
[11]
Agriculture and Rural Development of Oromia (ARDO), (2005). Socio-economic profile of North Shewa zone.
[12]
EthioSIS (Ethiopia Soil Information System) (2014). Soil fertility status and fertilizer recommendation atlas for Tigray regional state, Ethiopia.
[13]
Olsen, S. R., Cole C. V., Watanabe F. S. and Dean L. A., (1954). Estimation of available phosphorus in soils by extraction with sodium carbonate. USDA Circular, 1-19.
[14]
Taye B., Yesuf A., Sahlemedhin S., Amanuel G., Mohammed H., et al., (2000). Optimizing Fertilizer Use in Ethiopia: Correlation of Soil Analysis with Fertilizer Response in Hetosa Wereda, Arsi Zone. Sasakawa-Global 2000, Addis Ababa, Ethiopia.
Lemma, A., Donis, A., Muluna, M., Abera, W. (2025). Phosphorus Requirement Mapping for Bread Wheat at Wachale District, North Shewa Zone, Oromia. International Journal of Environmental Monitoring and Analysis, 13(3), 87-93. https://doi.org/10.11648/j.ijema.20251303.12
Lemma, A.; Donis, A.; Muluna, M.; Abera, W. Phosphorus Requirement Mapping for Bread Wheat at Wachale District, North Shewa Zone, Oromia. Int. J. Environ. Monit. Anal.2025, 13(3), 87-93. doi: 10.11648/j.ijema.20251303.12
Lemma A, Donis A, Muluna M, Abera W. Phosphorus Requirement Mapping for Bread Wheat at Wachale District, North Shewa Zone, Oromia. Int J Environ Monit Anal. 2025;13(3):87-93. doi: 10.11648/j.ijema.20251303.12
@article{10.11648/j.ijema.20251303.12,
  author = {Ajema Lemma and Abera Donis and Meseret Muluna and Woubalem Abera},
  title = {Phosphorus Requirement Mapping for Bread Wheat at Wachale District, North Shewa Zone, Oromia
},
  journal = {International Journal of Environmental Monitoring and Analysis},
  volume = {13},
  number = {3},
  pages = {87-93},
  doi = {10.11648/j.ijema.20251303.12},
  url = {https://doi.org/10.11648/j.ijema.20251303.12},
  eprint = {https://article.sciencepublishinggroup.com/pdf/10.11648.j.ijema.20251303.12},
  abstract = {Determination of soil phosphorus level is an important factor affecting crop production and P-use efficiency in the study area. Fertilizer requirement mapping is the way of determining fertilizer demanded by specific crop production type on the basis of soil sample testing results. In order to make efficient fertilizer application for wheat at Wachale district, the study was conducted to map phosphorus requirement for wheat crop. Starting from soil sample collection, laboratory analysis and interpretation and mapping standard methods and tools were used. The total soil samples collected for the wheat potential kebeles were 167 and phosphorus requirement mapping was done for analyzed soil samples. Based on the laboratory result, phosphorus requirement was calculated by subtracting initial soil phosphorus from phosphorus critical for wheat at the study area. Considering the minimum and maximum level of phosphorus requirement, the output of the result ranges from 18.04 to 45.98ppm for the areas under consideration with an average of 31.43ppm. Large areas (84393.29ha) of the district require 20 to 35ppm and the smallest area (348.64ha) require 15 to 20ppm of phosphorus fertilizer for wheat crop production. Consequently, phosphorus fertilizer application rate for wheat crop might be very efficient by using the map, otherwise using the mean rate (31.43ppm) appropriate than blanket application rate. The map of phosphorus requirement in ppm was predicted for unknown locations by using ordinary Kriging interpolation of ArcGIS10.3 software.
},
 year = {2025}
}
TY  - JOUR
T1  - Phosphorus Requirement Mapping for Bread Wheat at Wachale District, North Shewa Zone, Oromia

AU  - Ajema Lemma
AU  - Abera Donis
AU  - Meseret Muluna
AU  - Woubalem Abera
Y1  - 2025/06/23
PY  - 2025
N1  - https://doi.org/10.11648/j.ijema.20251303.12
DO  - 10.11648/j.ijema.20251303.12
T2  - International Journal of Environmental Monitoring and Analysis
JF  - International Journal of Environmental Monitoring and Analysis
JO  - International Journal of Environmental Monitoring and Analysis
SP  - 87
EP  - 93
PB  - Science Publishing Group
SN  - 2328-7667
UR  - https://doi.org/10.11648/j.ijema.20251303.12
AB  - Determination of soil phosphorus level is an important factor affecting crop production and P-use efficiency in the study area. Fertilizer requirement mapping is the way of determining fertilizer demanded by specific crop production type on the basis of soil sample testing results. In order to make efficient fertilizer application for wheat at Wachale district, the study was conducted to map phosphorus requirement for wheat crop. Starting from soil sample collection, laboratory analysis and interpretation and mapping standard methods and tools were used. The total soil samples collected for the wheat potential kebeles were 167 and phosphorus requirement mapping was done for analyzed soil samples. Based on the laboratory result, phosphorus requirement was calculated by subtracting initial soil phosphorus from phosphorus critical for wheat at the study area. Considering the minimum and maximum level of phosphorus requirement, the output of the result ranges from 18.04 to 45.98ppm for the areas under consideration with an average of 31.43ppm. Large areas (84393.29ha) of the district require 20 to 35ppm and the smallest area (348.64ha) require 15 to 20ppm of phosphorus fertilizer for wheat crop production. Consequently, phosphorus fertilizer application rate for wheat crop might be very efficient by using the map, otherwise using the mean rate (31.43ppm) appropriate than blanket application rate. The map of phosphorus requirement in ppm was predicted for unknown locations by using ordinary Kriging interpolation of ArcGIS10.3 software.

VL  - 13
IS  - 3
ER  -